

During the 2022-2023 school year, Teens in the Driver Seat (TDS) launched the 2nd annual Zero Hero activity to decrease electronic device use among teen pedestrians. The activity consists of a pre-observation, three weeks of messaging, and a post-observation completed by students. The activity was offered to all program schools. Ten schools completed this activity by returning all observation data.
High school and junior high school student teams were asked to observe teen walkers near their school campus and record if they were or were not visibly using an electronic device.
Questions regarding data may be directed to Christine Yager at c-yager@tti.tamu.edu.
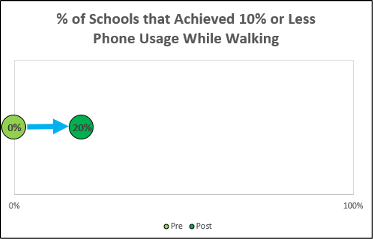

The above dot plot shows the percentage of all 10 schools who achieved 10% or less phone usage while walking between the pre- and post-observations. You can see that between the pre- and post-observations, there were significantly more schools who reached this benchmark after doing TDS distractions and pedestrian safety outreach on their campus. 80% of schools experienced a decrease in phone usage while walking between the pre- and post-observations.
All 2022 – 2023 Schools
| Pre-Counts | Post-Counts | % Change | |
| Teen Walker Sampling | 1,241 | 668 | |
| Total % of Teen Walkers Using an Electronic Device | 29.18% | 19.43% | -33.41% |
| First Year Schools (i.e. the first year that a school completed this activity) | |||
| Teen Walker Sampling | 1,090 | 537 | |
| Total % of Teen Walkers Using an Electronic Device | 29.52% | 18.82% | -36.25% |
| Multi-Year Schools (the latest year that a school completed this activity) | |||
| Teen Walker Sampling | 151 | 131 | |
| Total % of Teen Walkers Using an Electronic Device | 26.68% | 21.92% | -17.83% |
The following sections show state-specific Zero Hero Distracted Walking Results
Texas 2022 – 2023 Schools
(n=3 schools)
| Pre-Counts | Post-Counts | % Change | |
| Teen Walker Sampling | 185 | 156 | |
| Total % of Teen Walkers Using an Electronic Device | 38.41% | 26.41% | -31.23% |
| First Year Schools (i.e. the first year that a school completed this activity) | |||
| Teen Walker Sampling | 135 | 106 | |
| Total % of Teen Walkers Using an Electronic Device | 44.48% | 20.94% | -52.92% |
| Multi-Year Schools (the latest year that a school completed this activity) | |||
| Teen Walker Sampling | 50 | 50 | |
| Total % of Teen Walkers Using an Electronic Device | 22.00% | 38.00% | +72.73% |
Georgia 2022 – 2023 Schools
(n=1 first-year school)
| Pre-Counts | Post-Counts | % Change | |
| Teen Walker Sampling | 95 | 60 | |
| Total % of Teen Walkers Using an Electronic Device | 66.00% | 28.00% | -57.58% |
Nebraska 2022 – 2023 Schools
(n=2 first-year schools)
| Pre-Counts | Post-Counts | % Change | |
| Teen Walker Sampling | 142 | 140 | |
| Total % of Teen Walkers Using an Electronic Device | 21.94% | 15.15% | -30.96% |
Colorado 2022 – 2023 Schools
(n=2 schools)
| Pre-Counts | Post-Counts | % Change | |
| Teen Driver Sampling | 151 | 131 | |
| Total % of Teen Drivers Using an Electronic Device | 46.55% | 20.40% | -56.15% |
| First Year Schools (i.e. the first year that a school completed this activity) | |||
| Teen Driver Sampling | 50 | 50 | |
| Total % of Teen Drivers Using an Electronic Device | 82.00% | 34.00% | -58.54% |
| Multi-Year Schools (the latest year that a school completed this activity) | |||
| Teen Driver Sampling | 101 | 81 | |
| Total % of Teen Drivers Using an Electronic Device | 29.00% | 12.00% | -58.62% |