


High school student teams were asked to observe teen drivers and passengers and log if they did or did not have their seat belts fastened. Junior High student teams were asked to observe teen passengers and log seat belt use. Some high schools with a low percentage of teen drivers also chose to count only teen passengers.
Texas High Schools have reached over 90% seat belt usage rate by teen drivers.
All Vehicles with Teen Drivers Weighted Aggregate
| Pre-Counts | Post-Counts | % Change | |
| All 2018 Schools – Vehicles with Teen Drivers | |||
| Teen Driver Sampling | 4,648 | 5,440 | |
| Total % of Teen Drivers Wearing a Seat Belt | 85.19% | 88.46% | +3.27% |
| Teen Passenger Sampling | 3,152 | 3,489 | |
| Total % of Teen Passengers Wearing a Seat Belt | 76.84% | 80.57% | +3.73% |
| First Year Schools (i.e. taken from the first year schools completed the activity 2013-2018) | |||
| Teen Driver Sampling | 12,071 | 11,336 | |
| Total % of Teen Drivers Wearing a Seat Belt | 82.48% | 85.09% | +2.61% |
| Teen Passenger Sampling | 8,256 | 7,049 | |
| Total % of Teen Passengers Wearing a Seat Belt | 71.65% | 74.58% | +2.94% |
| Multi-Year Schools last year completed (i.e. taken from the latest year schools which have completed the activity 2, 3, 4, 5, or 6 years) | |||
| Teen Driver Sampling | 3,547 | 3,766 | |
| Total % of Teen Drivers Wearing a Seat Belt | 87.48% | 92.21% | +4.73% |
| Teen Passenger Sampling | 2,302 | 2,315 | |
| Total % of Teen Passengers Wearing a Seat Belt | 78.74% | 86.58% | +7.84% |
Texas Vehicles with Teen Drivers – Weighted Aggregate
| Pre-Counts | Post-Counts | % Change | |
| Texas 2018 participants (14 schools) | |||
| Total % of Teen Drivers Wearing a Seat Belt | 89.28% | 90.74% | +1.47% |
| Total % of Teen Passengers Wearing a Seat Belt | 82.08% | 79.31% | -2.77% |
| Texas First Year Schools (i.e. taken from the first year schools completed the activity 2013-2018, 31 schools) | |||
| Total % of Teen Drivers Wearing a Seat Belt | 85.34% | 89.38% | +0.65% |
| Total % of Teen Passengers Wearing a Seat Belt | 73.43% | 75.81% | +2.38% |
| Texas Multi-Year Schools last year completed (i.e. taken from the latest year which have completed the activity 2, 3, 4, 5, or 6 years, 14 schools) | |||
| Total % of Teen Drivers Wearing a Seat Belt | 89.46% | 93.91% | +4.45% |
| Total % of Teen Passengers Wearing a Seat Belt | 85.95% | 89.32% | +3.37% |
Georgia Vehicles with Teen Drivers – Weighted Aggregate
| Pre-Counts | Post-Counts | % Change | |
| Georgia 2018 participants (11 schools) | |||
| Total % of Teen Drivers Wearing a Seat Belt | 86.67% | 90.12% | +3.44% |
| Total # of Teen Passengers Wearing a Seat Belt | 73.46% | 83.97% | +10.51% |
| Georgia First Year Schools (i.e. taken from the first year schools completed the activity 2014-2018, 19 schools) | |||
| Total % of Teen Drivers Wearing a Seat Belt | 80.21% | 81.47% | +1.26% |
| Total # of Teen Passengers Wearing a Seat Belt | 66.55% | 72.72% | +6.18% |
| Georgia Multi-Year Schools last year completed (i.e. taken from the latest year schools which have completed the activity 2, 3, or 4 years, 5 schools) | |||
| Total % of Teen Drivers Wearing a Seat Belt | 90.73% | 96.79% | +6.06% |
| Total # of Teen Passengers Wearing a Seat Belt | 75.22% | 89.61% | +14.39% |
Nebraska Vehicles with Teen Drivers – Weighted Aggregate
| Pre-Counts | Post-Counts | % Change | |
| Nebraska 2018 participants (7 schools) | |||
| Total % of Teen Drivers Wearing a Seat Belt | 69.91% | 74.19% | +4.27% |
| Total # of Teen Passengers Wearing a Seat Belt | 63.85% | 72.07% | +8.22% |
| Nebraska First Year Schools (i.e. taken from the first year schools completed the activity 2014-2018, 15 schools) | |||
| Total % of Teen Drivers Wearing a Seat Belt | 63.09% | 72.35% | +7.02% |
| Total # of Teen Passengers Wearing a Seat Belt | 59.51% | 59.43% | -0.08% |
| Nebraska Multi-Year Schools last year completed (i.e. taken from the latest year schools which have completed the activity 2, 3, 4, or 5 years, 6 schools) | |||
| Total % of Teen Drivers Wearing a Seat Belt | 77.63% | 78.73% | +1.10% |
| Total # of Passengers Wearing a Seat Belt | 65.30% | 76.39% | +11.09% |
Multi-Year Schools, 2015 – 2018 data (not enough data pre-2015)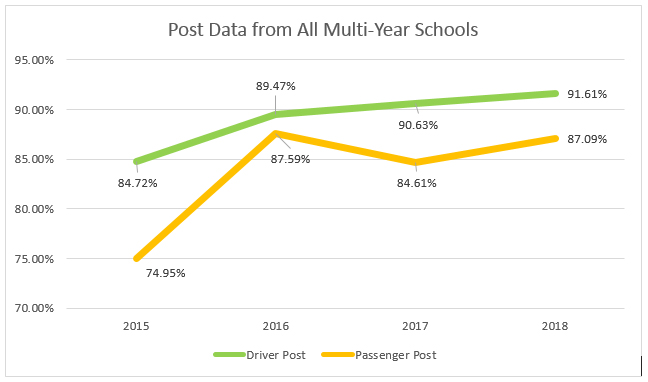
Questions regarding data may be directed to Stacey Tisdale at s-tisdale@tti.tamu.edu or Russell Henk at r-henk@tti.tamu.edu.