


During the fall of 2017, Teens in the Driver Seat (TDS) launched the 5th annual Zero Crazy activity to increase seat belt use among teen drivers and passengers at TDS schools. The activity consists of a pre-observation, three weeks of messaging, a post-observation, and a pizza party for the schools that completed and returned all observation data. The activity was offered to all program schools. Sixty-six schools signed up to complete the activity, forty-two completed the pre-observations and thirty-four of those returned all data.
High school student teams were asked to observe teen drivers and passengers and log if they did or did not have their seat belts fastened. Junior High student teams were asked to observe teen passengers and log seat belt use. Some high schools with a low percentage of teen drivers also chose to count adult drivers.
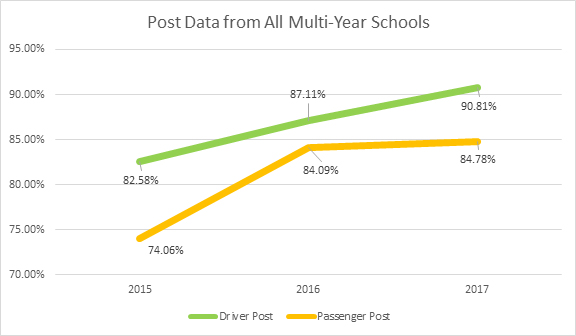
TDS schools have reached over 90% seat belt usage rate by Texas High Schools.
All Schools Weighted Aggregate
| Pre-Counts | Post-Counts | % Change | |
| All 2017 participants | |||
| Total # of Drivers Wearing a Seat Belt | 83.85% | 87.45% | +3.60% |
| Total # of Passengers Wearing a Seat Belt | 72.06% | 82.75% | +10.51% |
| First Year Schools (i.e. taken from the first year schools completed the activity 2013-2017) | |||
| Total # of Drivers Wearing a Seat Belt | 82.53% | 84.50% | +1.96% |
| Total # of Passengers Wearing a Seat Belt | 70.82% | 74.58% | +3.76% |
| Multi-Year Schools last year completed (i.e. taken from the latest year schools which have completed the activity 2, 3, 4, or 5 years) | |||
| Total # of Drivers Wearing a Seat Belt | 86.91% | 91.71% | +4.80% |
| Total # of Passengers Wearing a Seat Belt | 75.96% | 86.17% | +10.21% |
Texas High Schools Weighted Aggregate
| Pre-Counts | Post-Counts | % Change | |
| Texas 2017 participants (9 schools) | |||
| Total # of Drivers Wearing a Seat Belt | 85.78% | 90.17% | +4.40% |
| Total # of Passengers Wearing a Seat Belt | 78.33% | 87.53% | +9.20% |
| Texas First Year Schools (i.e. taken from the first year schools completed the activity 2013-2017, 24 schools) | |||
| Total # of Drivers Wearing a Seat Belt | 84.43% | 87.45% | +3.02% |
| Total # of Passengers Wearing a Seat Belt | 71.27% | 75.78% | +4.51% |
| Texas Multi-Year Schools last year completed (i.e. taken from the latest year which have completed the activity 2, 3, 4, or 5 years, 11 schools) | |||
| Total # of Drivers Wearing a Seat Belt | 91.44% | 96.03% | +3.02% |
| Total # of Passengers Wearing a Seat Belt | 86.33% | 91.94% | +5.61% |
Georgia High Schools Weighted Aggregate
| Pre-Counts | Post-Counts | % Change | |
| Georgia 2017 participants (8 schools) | |||
| Total # of Drivers Wearing a Seat Belt | 83.92% | 84.74% | +2.82% |
| Total # of Passengers Wearing a Seat Belt | 60.84% | 76.97% | +16.13% |
| Georgia First Year Schools (i.e. taken from the first year schools completed the activity 2014-2017, 13 schools) | |||
| Total # of Drivers Wearing a Seat Belt | 79.71% | 80.81% | +1.10% |
| Total # of Passengers Wearing a Seat Belt | 64.49% | 70.26% | +5.77% |
| Georgia Multi-Year Schools last year completed (i.e. taken from the latest year schools which have completed the activity 2, 3, 4, or 5 years, 4 schools) | |||
| Total # of Drivers Wearing a Seat Belt | 87.49% | 92.91% | +5.42% |
| Total # of Passengers Wearing a Seat Belt | 61.66% | 83.91% | +22.25% |
Nebraska High Schools Weighted Aggregate
| Pre-Counts | Post-Counts | % Change | |
| Nebraska 2017 participants (7 schools) | |||
| Total # of Drivers Wearing a Seat Belt | 75.99% | 80.88% | +4.89% |
| Total # of Passengers Wearing a Seat Belt | 76.99% | 77.34% | +0.35% |
| Nebraska First Year Schools (i.e. taken from the first year schools completed the activity 2013-2017, 13 schools) | |||
| Total # of Drivers Wearing a Seat Belt | 64.97% | 74.39% | +9.41% |
| Total # of Passengers Wearing a Seat Belt | 59.94% | 80.02% | +20.08% |
| Nebraska Multi-Year Schools last year completed (i.e. taken from the latest year schools which have completed the activity 2, 3, 4, or 5 years, 4 schools) | |||
| Total # of Drivers Wearing a Seat Belt | 77.00% | 79.32% | +2.33% |
| Total # of Passengers Wearing a Seat Belt | 73.99% | 70.73% | -3.23% |
Multi-Year High Schools, 2015, 2016, and 2017 data (not enough data pre-2015)
Data taken from multi-year high schools (one or more previous year(s) of activity) from displayed year. Post data shows that schools that complete the activity are achieving a higher seat belt year-over-year.

Questions regarding data may be directed to Stacey Tisdale at s-tisdale@tti.tamu.edu or Russell Henk at r-henk@tti.tamu.edu.