

During the spring of 2018, Teens in the Driver Seat (TDS) supported an activity at TDS schools to decrease electronic use among teen drivers and adult drivers who transport students. The activity, Zero Crazy, is in its fifth year and consists of a pre-observation, three weeks of messaging, a post-observation, and a pizza party for schools that completed and returned all observation data. The activity was offered to all program schools. Thirty-six high schools and junior high schools signed up to complete the activity, twenty-one of those returned all data and received a report of their results and a $50 gift card for their accomplishment.
High school student teams were asked to observe teen drivers and log if they were or were not visibly using an electronic device. Junior High student teams were asked to observe adult drivers and log electronic use.
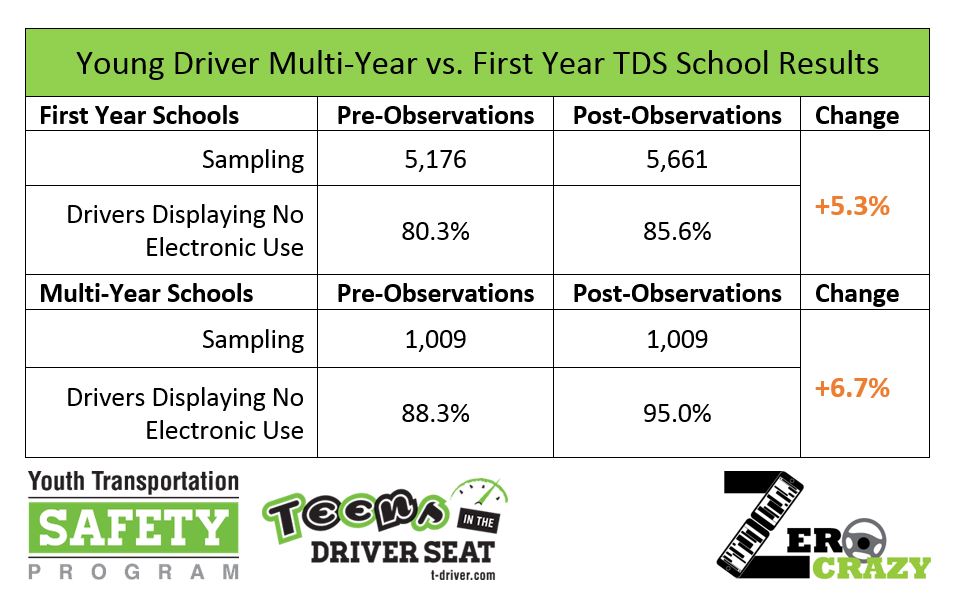
The 2018 data again suggests teens are more distracted behind the wheel than adults, which is on par with national statistics. As a continuation of last year’s discovery, when we compare schools that have participated in the activity multiple years with first-year activity schools, we found that the multi-year (participated 2, 3, 4, and 5 years) young driver pre-observations were higher than first-year young driver pre-observations. These results suggest regular focus on this risk is resulting in less young driver distractions over time.
Questions may be directed to Stacey Tisdale at s-tisdale@tti.tamu.edu.
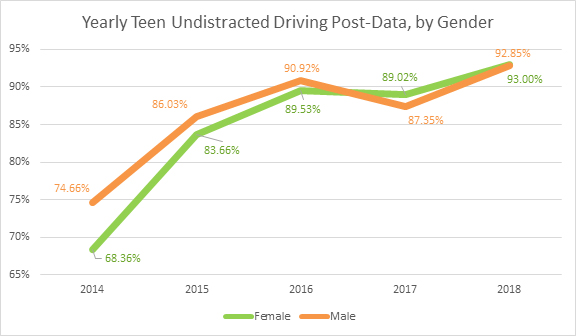
This year, we looked at annual post-data by gender and found that female teen drivers surpassed, then matched matched male teen drivers for undistracted driving over the last two years.
Young Driver Multi-Year vs. First Year School Results
(Contains only schools that observed teens in their pre- and post-observations. Weighted average.)
First Year Schools
Pre-Observations Post-Observations
Sampling 5,176 5,661
Drivers displaying no electronic use 80.3% 85.6% +5.3%
Multiple Year Schools
Pre-Observations Post-Observations
Sampling 1,009 1,009
Drivers displaying no electronic use 88.3% 95.0% +6.7%
All School 2018 Results
(Weighted average.)
Pre-Observations Post-Observations
Sampling 2,029 2,108
Drivers displaying no electronic use 85.1% 90.3% +4.8%
Texas Results
(Weighted average.)
Texas High Schools (teen drivers)
Pre-Observations Post-Observations
Sampling 732 753
Drivers displaying no electronic use 79.9% 90.4% +10.5%
Texas Junior High Schools (adult drivers)
Pre-Observations Post-Observations
Sampling 124 129
Drivers displaying no electronic use 88.0% 91.0% +3.0%
Nebraska Results (teen drivers)
(Weighted average.)
Pre-Observations Post-Observations
Sampling 340 340
Drivers displaying no electronic use 85.5% 90.3% +4.8%
Colorado Results (teen drivers)
(Weighted average.)
Pre-Observations Post-Observations
Sampling 268 287
Drivers displaying no electronic use 84.8% 90.9% +6.1%
Georgia Results
(Weighted average.)
Georgia High Schools (teen drivers)
Pre-Observations Post-Observations
Sampling 589 628
Drivers displaying no electronic use 89.1% 97.3% +8.2%
Georgia Junior High Schools (adult drivers)
Pre-Observations Post-Observations
Sampling 71 73
Drivers displaying no electronic use 86.0% 84.0% -2.0%
State Farm School Results (teen drivers)
(Weighted average.)
Pre-Observations Post-Observations
Sampling 100 100
Drivers displaying no electronic use 99.0% 99.0% +0.0%